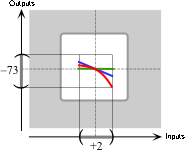
\( \hspace{10mm} \left.x\right|_{x\gets\bbox[1pt,yellow]{+2+h}}\xrightarrow{\hspace{1mm} CUBIC\hspace{1mm}}\left. CUBIC(x)\right|_{x\gets\bbox[1pt,yellow]{+2+h}} =\left. -4x^{3}-10x^{2}+7x-15\right|_{x\gets\bbox[1pt,yellow]{+2+h}} \)
\( \hspace{10mm} \bbox[1pt,yellow]{ +2+h } \xrightarrow{\hspace{1mm} CUBIC\hspace{1mm}} CUBIC( \bbox[1pt,yellow]{ +2+h } ) = \bbox[1pt,00FF99]{ -4 } {\large (} \bbox[1pt,yellow]{ +2+h } {\large )}^{3}\hspace{-1mm} \bbox[1pt,00FF99]{ -10 } {\large (} \bbox[1pt,yellow]{ +2+h } {\large )}^{2}\hspace{-1mm} \bbox[1pt,00FF99]{ +7 } {\large (} \bbox[1pt,yellow]{ +2+h } {\large )} \bbox[1pt,00FF99]{ -15 } \)
\( \hspace{10mm} +2+h\xrightarrow{\hspace{1mm} CUBIC\hspace{1mm}} CUBIC(+2+h) = \bbox[1pt,00FF99]{ -4 } {\LARGE ( } \bbox[1pt,yellow]{ (+2)^{3}+3\cdot(+2)^{2}h+3\cdot(+2)h^{2}+h^{3} } {\LARGE )} \bbox[1pt,00FF99]{ -10 } {\LARGE (} \bbox[1pt,yellow]{ (+2)^{2}+2\cdot(+2)h+h^{2} } {\LARGE )} \bbox[1pt,00FF99]{ +7 } {\LARGE (} \bbox[1pt,yellow]{ +2+h } {\LARGE )} \bbox[1pt,00FF99]{ -15 } \)
\( \hspace{76mm} = \bbox[1pt,00FF99]{ -4 } {\LARGE (} \hspace{2mm} \bbox[1pt,yellow]{ +8 } \hspace{1mm} \bbox[1pt,yellow]{ } \hspace{7mm} \bbox[1pt,yellow]{ +12h } \hspace{9mm} \bbox[1pt,yellow]{ +6h^{2} } \hspace{6mm} \bbox[1pt,yellow]{ +h^{3} } \hspace{0mm} {\LARGE )} \bbox[1pt,00FF99] { -10 } {\LARGE (} \hspace{1mm} \bbox[1pt,yellow]{ +4 } \hspace{8mm} \bbox[1pt,yellow]{ +4h } \hspace{5mm} \bbox[1pt,yellow]{ +h^{2} } \hspace{1mm} {\LARGE )} \bbox[1pt,00FF99]{ +7 } {\LARGE (} \bbox[1pt,yellow]{ +2+h } {\LARGE )} \bbox[1pt,00FF99] { -15 } \)
\( \hspace{76mm} = \hspace{6mm} {\LARGE (} \hspace{0mm} \bbox[1pt,F4F4F4]{ -32 } \hspace{7mm} \bbox[1pt,F4F4F4]{ -48h } \hspace{7mm} \bbox[1pt,F4F4F4]{ -24h^{2} } \hspace{5mm} \bbox[1pt,F4F4F4]{ -4h^{3} } \hspace{0mm} {\LARGE )} \hspace{3mm} + \hspace{3mm} {\LARGE (} \hspace{0mm} \bbox[1pt,F4F4F4]{ -40 } \hspace{4mm} \bbox[1pt,F4F4F4]{ -40h } \hspace{3mm} \bbox[1pt,F4F4F4]{ -10h^{2} } \hspace{0mm} {\LARGE )} \hspace{3mm} + \hspace{2mm} {\LARGE (} \hspace{0mm} \bbox[1pt,F4F4F4]{ +14 } \hspace{1mm} \bbox[1pt,F4F4F4]{ +7h } \hspace{0mm} {\LARGE )} \bbox[1pt,F4F4F4]{ -15 } \)
\( \hspace{76mm} = \hspace{6mm} {\LARGE (} \hspace{0mm} \bbox[1pt,F4F4F4]{ -32h^{0} } \hspace{2mm} \bbox[1pt,F4F4F4]{ -48h^{+1} } \hspace{2mm} \bbox[1pt,F4F4F4]{ -24h^{+2} } \hspace{2mm} \bbox[1pt,F4F4F4]{ -4h^{+3} } \hspace{0mm} {\LARGE )} \hspace{3mm} + \hspace{3mm} {\LARGE (} \hspace{0mm} \bbox[1pt,F4F4F4]{ -40h^{0} } \hspace{0mm} \bbox[1pt,F4F4F4]{ -40h^{+1} } \hspace{0mm} \bbox[1pt,F4F4F4]{ -10h^{+2} } \hspace{0mm} {\LARGE )} \hspace{3mm} + \hspace{2mm} {\LARGE (} \hspace{0mm} \bbox[1pt,F4F4F4]{ +14h^{0} } \hspace{0mm} \bbox[1pt,F4F4F4]{ +7h^{+1} } \hspace{0mm} {\LARGE )} \bbox[1pt,F4F4F4]{ -15h^{0} } \)
\( \hspace{10mm} +2+h \xrightarrow{ \hspace{1mm} CUBIC \hspace{1mm} } CUBIC(+2+h) = {\LARGE [} \hspace{0mm} \bbox[1pt,F4F4F4]{ -32 } \hspace{0mm} \bbox[1pt,F4F4F4]{ -40 } \hspace{0mm} \bbox[1pt,F4F4F4]{ +14 } \hspace{0mm} \bbox[1pt,F4F4F4]{ -15 } \hspace{0mm} \hspace{0mm} {\LARGE ]} h^{0} + {\LARGE [} \bbox[1pt,F4F4F4]{ -48 } \hspace{0mm} \bbox[1pt,F4F4F4]{ -40 } \hspace{0mm} \bbox[1pt,F4F4F4]{ +7 } \hspace{0mm} {\LARGE ]} h^{+1} +{\LARGE [} \hspace{0mm} \bbox[1pt,F4F4F4]{ -24-10 } {\LARGE ]} \bbox[1pt,F4F4F4]{ h^{+2} } +{\LARGE [} \hspace{2mm} \bbox[1pt,F4F4F4]{ -4 } \hspace{2mm} {\LARGE ]} h^{+3} \)
\( \hspace{77mm} = {\LARGE [} \hspace{16mm} \bbox[1pt,F4F4F4]{ -73 } \hspace{16mm} {\LARGE ]} h^{0} +{\LARGE [} \hspace{10mm} \bbox[1pt,F4F4F4]{ -81 } \hspace{10mm} {\LARGE ]} h^{+1} +{\LARGE [} \hspace{5mm} \bbox[1pt,F4F4F4]{ -34 } \hspace{5mm} {\LARGE ]} \bbox[1pt,F4F4F4]{ h^{+2} } + {\LARGE [} \hspace{2mm} \bbox[1pt,F4F4F4]{ -4 } \hspace{2mm} {\LARGE ]} h^{+3} \)
\( \hspace{77mm} = {\LARGE [} \hspace{16mm} \bbox[1pt,F4F4F4]{ -73 } \hspace{16mm} {\LARGE ]} \bbox[1pt,F4F4F4]{ h^{0} } +{\LARGE [} \hspace{10mm} \bbox[1pt,F4F4F4]{ -1 } \hspace{10mm} {\LARGE ]} \bbox[1pt,F4F4F4]{ h^{+1} } +{\LARGE [} \hspace{5mm} \bbox[1pt,F4F4F4]{ -1 } \hspace{5mm} {\LARGE ]} \bbox[1pt,F4F4F4]{ h^{+2} } + {\LARGE [} \hspace{2mm} \bbox[1pt,F4F4F4]{ -1 } \hspace{2mm} {\LARGE ]} h^{+3} \)
\( \hspace{77mm} = {\LARGE [} \hspace{16mm} \bbox[1pt,F4F4F4]{ -73 } \hspace{16mm} {\LARGE ]} \bbox[1pt,F4F4F4]{ h^{0} } +{\LARGE [} \hspace{10mm} \bbox[1pt,F4F4F4]{ -1 } \hspace{10mm} {\LARGE ]} \bbox[1pt,F4F4F4]{ h^{+1} } +{\LARGE [} \hspace{5mm} \bbox[1pt,F4F4F4]{ -1 } \hspace{5mm} {\LARGE ]} \bbox[1pt,F4F4F4]{ h^{+2} } +{\LARGE [} \hspace{1mm} \bbox[1pt,F4F4F4]{ . . . } \hspace{1mm} {\LARGE ]} \)
-
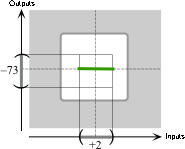
the power function
\(
x\xrightarrow{\hspace{1mm}P\hspace{1mm}}P(x)= -1x^{0}
\).
Since the exponent is \(0\) and the coefficient is negative, the local graph of \(P\) near \(0\) is:
-
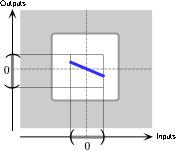
the power function
\(
x\xrightarrow{\hspace{1mm}Q\hspace{1mm}}Q(x)= -1x^{+1}
\).
Since the exponent is \(+1\) and the coefficient is negative, the local graph of \(Q\) near \(0\) is:
-
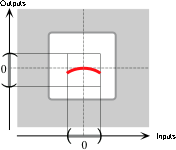
the power function
\(
x\xrightarrow{\hspace{1mm}R\hspace{1mm}}R(x)= -1x^{+2}
\).
Since the exponent is positive even and the coefficient is negative, the local graph of \(R\) near \(0\) is:

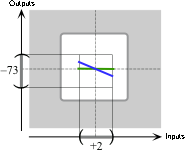
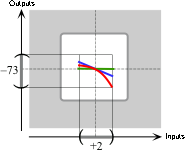
In the given global input-output rule,
jQuery UI Dialog functionality
To declare an input is to say which specific input is to be used. It is coded as follows
\[\left. \right|_{x\gets \text{specific input}} \]
the input to be
\(
\bbox[1pt,yellow]{
\text{near }+2
}
\)
:
\( \hspace{10mm} \left.x\right|_{x\gets\bbox[1pt,yellow]{+2+h}}\xrightarrow{\hspace{1mm} CUBIC\hspace{1mm}}\left. CUBIC(x)\right|_{x\gets\bbox[1pt,yellow]{+2+h}} =\left. -4x^{3}-10x^{2}+7x-15\right|_{x\gets\bbox[1pt,yellow]{+2+h}} \)
jQuery UI Dialog functionality
To execute a declaration is actually to replace \(x\) by the given input.
the declaration.
\(
\hspace{10mm}
\left.x\right|_{x\gets\bbox[1pt,yellow]{+2+h}}\xrightarrow{\hspace{1mm} CUBIC\hspace{1mm}}\left. CUBIC(x)\right|_{x\gets\bbox[1pt,yellow]{+2+h}}
=\left. -4x^{3}-10x^{2}+7x-15\right|_{x\gets\bbox[1pt,yellow]{+2+h}}
\)
\(
\hspace{10mm}
\bbox[1pt,yellow]{
+2+h
}
\xrightarrow{\hspace{1mm} CUBIC\hspace{1mm}} CUBIC(
\bbox[1pt,yellow]{
+2+h
}
)
=
\bbox[1pt,00FF99]{
-4
}
{\large (}
\bbox[1pt,yellow]{
+2+h
}
{\large )}^{3}\hspace{-1mm}
\bbox[1pt,00FF99]{
-10
}
{\large (}
\bbox[1pt,yellow]{
+2+h
}
{\large )}^{2}\hspace{-1mm}
\bbox[1pt,00FF99]{
+7
}
{\large (}
\bbox[1pt,yellow]{
+2+h
}
{\large )}
\bbox[1pt,00FF99]{
-15
}
\)
\(CUBIC(+2+h)\)
using the
for
\(
\hspace{10mm}
\left.x\right|_{x\gets\bbox[1pt,yellow]{+2+h}}\xrightarrow{\hspace{1mm} CUBIC\hspace{1mm}}\left. CUBIC(x)\right|_{x\gets\bbox[1pt,yellow]{+2+h}}
=\left. -4x^{3}-10x^{2}+7x-15\right|_{x\gets\bbox[1pt,yellow]{+2+h}}
\)
\(
\hspace{10mm}
\bbox[1pt,yellow]{
+2+h
}
\xrightarrow{\hspace{1mm} CUBIC\hspace{1mm}} CUBIC(
\bbox[1pt,yellow]{
+2+h
}
)
=
\bbox[1pt,00FF99]{
-4
}
{\large (}
\bbox[1pt,yellow]{
+2+h
}
{\large )}^{3}\hspace{-1mm}
\bbox[1pt,00FF99]{
-10
}
{\large (}
\bbox[1pt,yellow]{
+2+h
}
{\large )}^{2}\hspace{-1mm}
\bbox[1pt,00FF99]{
+7
}
{\large (}
\bbox[1pt,yellow]{
+2+h
}
{\large )}
\bbox[1pt,00FF99]{
-15
}
\)
\(
{\large (}
x_{0}+h
{\large )}^{3}
\text{ and for }
{\large (}
x_{0}+h
{\large )}^{2}
\hspace{-1mm}
:
\)
Expand 2
\[ \hspace{10mm} +2+h\xrightarrow{\hspace{1mm} CUBIC\hspace{1mm}} CUBIC(+2+h) = \bbox[1pt,00FF99]{ -4 } {\LARGE ( } \bbox[1pt,yellow]{ (+2)^{3}+3\cdot(+2)^{2}h+3\cdot(+2)h^{2}+h^{3} } {\LARGE )} \bbox[1pt,00FF99]{ -10 } {\LARGE (} \bbox[1pt,yellow]{ (+2)^{2}+2\cdot(+2)h+h^{2} } {\LARGE )} \bbox[1pt,00FF99]{ +7 } {\LARGE (} \bbox[1pt,yellow]{ +2+h } {\LARGE )} \bbox[1pt,00FF99]{ -15 } \] \[ \hspace{76mm} = \bbox[1pt,00FF99]{ -4 } {\LARGE (} \hspace{2mm} \bbox[1pt,yellow]{ +8 } \hspace{1mm} \bbox[1pt,yellow]{ } \hspace{7mm} \bbox[1pt,yellow]{ +12h } \hspace{9mm} \bbox[1pt,yellow]{ +6h^{2} } \hspace{6mm} \bbox[1pt,yellow]{ +h^{3} } \hspace{0mm} {\LARGE )} \bbox[1pt,00FF99] { -10 } {\LARGE (} \hspace{1mm} \bbox[1pt,yellow]{ +4 } \hspace{8mm} \bbox[1pt,yellow]{ +4h } \hspace{5mm} \bbox[1pt,yellow]{ +h^{2} } \hspace{1mm} {\LARGE )} \bbox[1pt,00FF99]{ +7 } {\LARGE (} \bbox[1pt,yellow]{ +2+h } {\LARGE )} \bbox[1pt,00FF99] { -15 } \]
Expand 3
\[ \hspace{10mm} +2+h\xrightarrow{\hspace{1mm} CUBIC\hspace{1mm}} CUBIC(+2+h) = \bbox[1pt,00FF99]{ -4 } {\LARGE ( } \bbox[1pt,yellow]{ (+2)^{3}+3\cdot(+2)^{2}h+3\cdot(+2)h^{2}+h^{3} } {\LARGE )} \bbox[1pt,00FF99]{ -10 } {\LARGE (} \bbox[1pt,yellow]{ (+2)^{2}+2\cdot(+2)h+h^{2} } {\LARGE )} \bbox[1pt,00FF99]{ +7 } {\LARGE (} \bbox[1pt,yellow]{ +2+h } {\LARGE )} \bbox[1pt,00FF99]{ -15 } \] \[ \hspace{76mm} = \bbox[1pt,00FF99]{ -4 } {\LARGE (} \hspace{2mm} \bbox[1pt,yellow]{ +8 } \hspace{1mm} \bbox[1pt,yellow]{ } \hspace{7mm} \bbox[1pt,yellow]{ +12h } \hspace{9mm} \bbox[1pt,yellow]{ +6h^{2} } \hspace{6mm} \bbox[1pt,yellow]{ +h^{3} } \hspace{0mm} {\LARGE )} \bbox[1pt,00FF99] { -10 } {\LARGE (} \hspace{1mm} \bbox[1pt,yellow]{ +4 } \hspace{8mm} \bbox[1pt,yellow]{ +4h } \hspace{5mm} \bbox[1pt,yellow]{ +h^{2} } \hspace{1mm} {\LARGE )} \bbox[1pt,00FF99]{ +7 } {\LARGE (} \bbox[1pt,yellow]{ +2+h } {\LARGE )} \bbox[1pt,00FF99] { -15 } \] \[ \hspace{76mm} = \hspace{6mm} {\LARGE (} \hspace{0mm} \bbox[1pt,F4F4F4]{ -32 } \hspace{7mm} \bbox[1pt,F4F4F4]{ -48h } \hspace{7mm} \bbox[1pt,F4F4F4]{ -24h^{2} } \hspace{5mm} \bbox[1pt,F4F4F4]{ -4h^{3} } \hspace{0mm} {\LARGE )} \hspace{3mm} + \hspace{3mm} {\LARGE (} \hspace{0mm} \bbox[1pt,F4F4F4]{ -40 } \hspace{4mm} \bbox[1pt,F4F4F4]{ -40h } \hspace{3mm} \bbox[1pt,F4F4F4]{ -10h^{2} } \hspace{0mm} {\LARGE )} \hspace{3mm} + \hspace{2mm} {\LARGE (} \hspace{0mm} \bbox[1pt,F4F4F4]{ +14 } \hspace{1mm} \bbox[1pt,F4F4F4]{ +7h } \hspace{0mm} {\LARGE )} \bbox[1pt,F4F4F4]{ -15 } \]
Expand 4
\[ \hspace{10mm} +2+h\xrightarrow{\hspace{1mm} CUBIC\hspace{1mm}} CUBIC(+2+h) = \bbox[1pt,00FF99]{ -4 } {\LARGE ( } \bbox[1pt,yellow]{ (+2)^{3}+3\cdot(+2)^{2}h+3\cdot(+2)h^{2}+h^{3} } {\LARGE )} \bbox[1pt,00FF99]{ -10 } {\LARGE (} \bbox[1pt,yellow]{ (+2)^{2}+2\cdot(+2)h+h^{2} } {\LARGE )} \bbox[1pt,00FF99]{ +7 } {\LARGE (} \bbox[1pt,yellow]{ +2+h } {\LARGE )} \bbox[1pt,00FF99]{ -15 } \] \[ \hspace{76mm} = \bbox[1pt,00FF99]{ -4 } {\LARGE (} \hspace{2mm} \bbox[1pt,yellow]{ +8 } \hspace{1mm} \bbox[1pt,yellow]{ } \hspace{7mm} \bbox[1pt,yellow]{ +12h } \hspace{9mm} \bbox[1pt,yellow]{ +6h^{2} } \hspace{6mm} \bbox[1pt,yellow]{ +h^{3} } \hspace{0mm} {\LARGE )} \bbox[1pt,00FF99] { -10 } {\LARGE (} \hspace{1mm} \bbox[1pt,yellow]{ +4 } \hspace{8mm} \bbox[1pt,yellow]{ +4h } \hspace{5mm} \bbox[1pt,yellow]{ +h^{2} } \hspace{1mm} {\LARGE )} \bbox[1pt,00FF99]{ +7 } {\LARGE (} \bbox[1pt,yellow]{ +2+h } {\LARGE )} \bbox[1pt,00FF99] { -15 } \] \[ \hspace{76mm} = \hspace{6mm} {\LARGE (} \hspace{0mm} \bbox[1pt,F4F4F4]{ -32 } \hspace{7mm} \bbox[1pt,F4F4F4]{ -48h } \hspace{7mm} \bbox[1pt,F4F4F4]{ -24h^{2} } \hspace{5mm} \bbox[1pt,F4F4F4]{ -4h^{3} } \hspace{0mm} {\LARGE )} \hspace{3mm} + \hspace{3mm} {\LARGE (} \hspace{0mm} \bbox[1pt,F4F4F4]{ -40 } \hspace{4mm} \bbox[1pt,F4F4F4]{ -40h } \hspace{3mm} \bbox[1pt,F4F4F4]{ -10h^{2} } \hspace{0mm} {\LARGE )} \hspace{3mm} + \hspace{2mm} {\LARGE (} \hspace{0mm} \bbox[1pt,F4F4F4]{ +14 } \hspace{1mm} \bbox[1pt,F4F4F4]{ +7h } \hspace{0mm} {\LARGE )} \bbox[1pt,F4F4F4]{ -15 } \] \[ \hspace{76mm} = \hspace{6mm} {\LARGE (} \hspace{0mm} \bbox[1pt,F4F4F4]{ -32h^{0} } \hspace{2mm} \bbox[1pt,F4F4F4]{ -48h^{+1} } \hspace{2mm} \bbox[1pt,F4F4F4]{ -24h^{+2} } \hspace{2mm} \bbox[1pt,F4F4F4]{ -4h^{+3} } \hspace{0mm} {\LARGE )} \hspace{3mm} + \hspace{3mm} {\LARGE (} \hspace{0mm} \bbox[1pt,F4F4F4]{ -40h^{0} } \hspace{0mm} \bbox[1pt,F4F4F4]{ -40h^{+1} } \hspace{0mm} \bbox[1pt,F4F4F4]{ -10h^{+2} } \hspace{0mm} {\LARGE )} \hspace{3mm} + \hspace{2mm} {\LARGE (} \hspace{0mm} \bbox[1pt,F4F4F4]{ +14h^{0} } \hspace{0mm} \bbox[1pt,F4F4F4]{ +7h^{+1} } \hspace{0mm} {\LARGE )} \bbox[1pt,F4F4F4]{ -15h^{0} } \]
\(CUBIC(+2+h)\) in terms of \(h^{0}\), \(h^{1}\), \(h^{2}\), \(h^{3}\) :
\[ \hspace{10mm} +2+h \xrightarrow{ \hspace{1mm} CUBIC \hspace{1mm} } CUBIC(+2+h) = {\LARGE [} \hspace{0mm} \bbox[1pt,F4F4F4]{ -32 } \hspace{0mm} \bbox[1pt,F4F4F4]{ -40 } \hspace{0mm} \bbox[1pt,F4F4F4]{ +14 } \hspace{0mm} \bbox[1pt,F4F4F4]{ -15 } \hspace{0mm} \hspace{0mm} {\LARGE ]} h^{0} + {\LARGE [} \bbox[1pt,F4F4F4]{ -48 } \hspace{0mm} \bbox[1pt,F4F4F4]{ -40 } \hspace{0mm} \bbox[1pt,F4F4F4]{ +7 } \hspace{0mm} {\LARGE ]} h^{+1} +{\LARGE [} \hspace{0mm} \bbox[1pt,F4F4F4]{ -24-10 } {\LARGE ]} \bbox[1pt,F4F4F4]{ h^{+2} } +{\LARGE [} \hspace{2mm} \bbox[1pt,F4F4F4]{ -4 } \hspace{2mm} {\LARGE ]} h^{+3} \]
Reorganize 2
\[ \hspace{10mm} +2+h \xrightarrow{ \hspace{1mm} CUBIC \hspace{1mm} } CUBIC(+2+h) = {\LARGE [} \hspace{0mm} \bbox[1pt,F4F4F4]{ -32 } \hspace{0mm} \bbox[1pt,F4F4F4]{ -40 } \hspace{0mm} \bbox[1pt,F4F4F4]{ +14 } \hspace{0mm} \bbox[1pt,F4F4F4]{ -15 } \hspace{0mm} \hspace{0mm} {\LARGE ]} h^{0} + {\LARGE [} \bbox[1pt,F4F4F4]{ -48 } \hspace{0mm} \bbox[1pt,F4F4F4]{ -40 } \hspace{0mm} \bbox[1pt,F4F4F4]{ +7 } \hspace{0mm} {\LARGE ]} h^{+1} +{\LARGE [} \hspace{0mm} \bbox[1pt,F4F4F4]{ -24-10 } {\LARGE ]} \bbox[1pt,F4F4F4]{ h^{+2} } +{\LARGE [} \hspace{2mm} \bbox[1pt,F4F4F4]{ -4 } \hspace{2mm} {\LARGE ]} h^{+3} \] \[ \hspace{77mm} = {\LARGE [} \hspace{16mm} \bbox[1pt,F4F4F4]{ -73 } \hspace{16mm} {\LARGE ]} h^{0} +{\LARGE [} \hspace{10mm} \bbox[1pt,F4F4F4]{ -81 } \hspace{10mm} {\LARGE ]} h^{+1} +{\LARGE [} \hspace{5mm} \bbox[1pt,F4F4F4]{ -34 } \hspace{5mm} {\LARGE ]} \bbox[1pt,F4F4F4]{ h^{+2} } + {\LARGE [} \hspace{2mm} \bbox[1pt,F4F4F4]{ -4 } \hspace{2mm} {\LARGE ]} h^{+3} \]
\(CUBIC(+2+h)\)
\[ \hspace{10mm} +2+h \xrightarrow{ \hspace{1mm} CUBIC \hspace{1mm} } CUBIC(+2+h) = {\LARGE [} \hspace{0mm} \bbox[1pt,F4F4F4]{ -32 } \hspace{0mm} \bbox[1pt,F4F4F4]{ -40 } \hspace{0mm} \bbox[1pt,F4F4F4]{ +14 } \hspace{0mm} \bbox[1pt,F4F4F4]{ -15 } \hspace{0mm} \hspace{0mm} {\LARGE ]} h^{0} + {\LARGE [} \bbox[1pt,F4F4F4]{ -48 } \hspace{0mm} \bbox[1pt,F4F4F4]{ -40 } \hspace{0mm} \bbox[1pt,F4F4F4]{ +7 } \hspace{0mm} {\LARGE ]} h^{+1} +{\LARGE [} \hspace{0mm} \bbox[1pt,F4F4F4]{ -24-10 } {\LARGE ]} \bbox[1pt,F4F4F4]{ h^{+2} } +{\LARGE [} \hspace{2mm} \bbox[1pt,F4F4F4]{ -4 } \hspace{2mm} {\LARGE ]} h^{+3} \] \[ \hspace{77mm} = {\LARGE [} \hspace{16mm} \bbox[1pt,F4F4F4]{ -73 } \hspace{16mm} {\LARGE ]} h^{0} +{\LARGE [} \hspace{10mm} \bbox[1pt,F4F4F4]{ -81 } \hspace{10mm} {\LARGE ]} h^{+1} +{\LARGE [} \hspace{5mm} \bbox[1pt,F4F4F4]{ -34 } \hspace{5mm} {\LARGE ]} \bbox[1pt,F4F4F4]{ h^{+2} } + {\LARGE [} \hspace{2mm} \bbox[1pt,F4F4F4]{ -4 } \hspace{2mm} {\LARGE ]} h^{+3} \] \[ \hspace{77mm} = {\LARGE [} \hspace{16mm} \bbox[1pt,F4F4F4]{ -73 } \hspace{16mm} {\LARGE ]} \bbox[1pt,F4F4F4]{ h^{0} } +{\LARGE [} \hspace{10mm} \bbox[1pt,F4F4F4]{ -1 } \hspace{10mm} {\LARGE ]} \bbox[1pt,F4F4F4]{ h^{+1} } +{\LARGE [} \hspace{5mm} \bbox[1pt,F4F4F4]{ -1 } \hspace{5mm} {\LARGE ]} \bbox[1pt,F4F4F4]{ h^{+2} } + {\LARGE [} \hspace{2mm} \bbox[1pt,F4F4F4]{ -1 } \hspace{2mm} {\LARGE ]} h^{+3} \]
\(CUBIC(+2+h)\)
\[ \hspace{10mm} +2+h \xrightarrow{ \hspace{1mm} CUBIC \hspace{1mm} } CUBIC(+2+h) = {\LARGE [} \hspace{0mm} \bbox[1pt,F4F4F4]{ -32 } \hspace{0mm} \bbox[1pt,F4F4F4]{ -40 } \hspace{0mm} \bbox[1pt,F4F4F4]{ +14 } \hspace{0mm} \bbox[1pt,F4F4F4]{ -15 } \hspace{0mm} \hspace{0mm} {\LARGE ]} h^{0} + {\LARGE [} \bbox[1pt,F4F4F4]{ -48 } \hspace{0mm} \bbox[1pt,F4F4F4]{ -40 } \hspace{0mm} \bbox[1pt,F4F4F4]{ +7 } \hspace{0mm} {\LARGE ]} h^{+1} +{\LARGE [} \hspace{0mm} \bbox[1pt,F4F4F4]{ -24-10 } {\LARGE ]} \bbox[1pt,F4F4F4]{ h^{+2} } +{\LARGE [} \hspace{2mm} \bbox[1pt,F4F4F4]{ -4 } \hspace{2mm} {\LARGE ]} h^{+3} \] \[ \hspace{77mm} = {\LARGE [} \hspace{16mm} \bbox[1pt,F4F4F4]{ -73 } \hspace{16mm} {\LARGE ]} h^{0} +{\LARGE [} \hspace{10mm} \bbox[1pt,F4F4F4]{ -81 } \hspace{10mm} {\LARGE ]} h^{+1} +{\LARGE [} \hspace{5mm} \bbox[1pt,F4F4F4]{ -34 } \hspace{5mm} {\LARGE ]} \bbox[1pt,F4F4F4]{ h^{+2} } + {\LARGE [} \hspace{2mm} \bbox[1pt,F4F4F4]{ -4 } \hspace{2mm} {\LARGE ]} h^{+3} \] \[ \hspace{77mm} = {\LARGE [} \hspace{16mm} \bbox[1pt,F4F4F4]{ -73 } \hspace{16mm} {\LARGE ]} \bbox[1pt,F4F4F4]{ h^{0} } +{\LARGE [} \hspace{10mm} \bbox[1pt,F4F4F4]{ -1 } \hspace{10mm} {\LARGE ]} \bbox[1pt,F4F4F4]{ h^{+1} } +{\LARGE [} \hspace{5mm} \bbox[1pt,F4F4F4]{ -1 } \hspace{5mm} {\LARGE ]} \bbox[1pt,F4F4F4]{ h^{+2} } + {\LARGE [} \hspace{2mm} \bbox[1pt,F4F4F4]{ -1 } \hspace{2mm} {\LARGE ]} h^{+3} \] \[ \hspace{77mm} = {\LARGE [} \hspace{16mm} \bbox[1pt,F4F4F4]{ -73 } \hspace{16mm} {\LARGE ]} \bbox[1pt,F4F4F4]{ h^{0} } +{\LARGE [} \hspace{10mm} \bbox[1pt,F4F4F4]{ -1 } \hspace{10mm} {\LARGE ]} \bbox[1pt,F4F4F4]{ h^{+1} } +{\LARGE [} \hspace{5mm} \bbox[1pt,F4F4F4]{ -1 } \hspace{5mm} {\LARGE ]} \bbox[1pt,F4F4F4]{ h^{+2} } +{\LARGE [} \hspace{1mm} \bbox[1pt,F4F4F4]{ . . . } \hspace{1mm} {\LARGE ]} \]
the power function \( x\xrightarrow{\hspace{1mm}K\hspace{1mm}}K(x)= -1x^{0} \).
Since the exponent is \(0\) and the coefficient is negative, the local graph of \(K\) near \(0\) is:
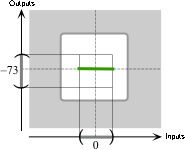
the local graph of \( x\xrightarrow{\hspace{1mm}K\hspace{1mm}}K(x)= -1x^{0} \) from \(0\) to \(+2\).
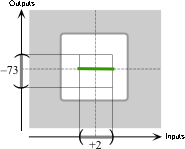
the power function \( x\xrightarrow{\hspace{1mm}L\hspace{1mm}}L(x)= -1x^{+1} \).
Since the exponent is \(+1\) and the coefficient is negative, the local graph of \(L\) near \(0\) is:

the local graph of \( x\xrightarrow{\hspace{1mm}L\hspace{1mm}}L(x)= -1x^{+1} \) from \(0\) to \(+2\).
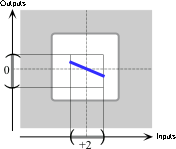
the local graph of \(L\) to the local graph of \(K\)

the power function \( x\xrightarrow{\hspace{1mm}Q\hspace{1mm}}Q(x)= -1x^{+2} \).
Since the exponent is positive even and the coefficient is negative, the local graph of \(Q\) near \(0\) is:

the local graph of \( x\xrightarrow{\hspace{1mm}Q\hspace{1mm}}Q(x)= -1x^{+2} \) from \(0\) to \(+2\),
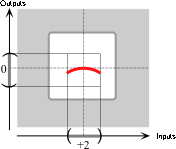
the local graph of \(Q\) to the local graph of \(K+L\)
